
Monthly commentary
Portfolio Performance
At 7IM, we believe that taking a long-term view is essential when investing. We can’t always avoid the short-term bumps and shocks that the financial world has in store, but a well-diversified portfolio goes a long way towards smoothing out some of the journey. The long-term nature of our strategic and tactical process is a good complement to the Succession Matrix Expected Parameters.
| Q1/2018 - Q1/2019 | Q1/2019 - Q1/2020 | Q1/2020 - Q1/2021 | Q1/2021 - Q1/2022 | Q1/2022 - Q1/2023 | 3 Year Ann. Return | 5 Year Ann. Return | Succession Matrix Expected Parameters – Ann. Return | |
|---|---|---|---|---|---|---|---|---|
| Defensive | 1.35% | -0.77% | 9.27% | 0.75% | -5.37% | 0.14% | 0.75% | 3.0 - 4.5% |
| Cautious | 0.71% | -2.54% | 13.96% | 2.41% | -4.47% | 2.28% | 1.63% | 4.5 - 6.0% |
| Balanced | 1.20% | -5.05% | 19.83% | 4.45% | -3.23% | 4.76% | 2.75% | 5.2 - 7.5% |
| Moderately Adventurous | 1.13% | -8.14% | 26.06% | 6.32% | -1.56% | 7.42% | 3.64% | 6.0 - 8.0% |
| Adventurous | 1.63% | -10.58% | 30.79% | 7.86% | -1.42% | 8.96% | 4.15% | 7.0 - 10.0% |
| Income | 3.28% | -8.68% | 18.97% | 4.16% | -3.28% | 4.43% | 2.33% |
Source: 7IM/FE. Annualised return is defined as ‘Ann. Return’ in the performance table above and is as at end April 2023. Market returns have been poor in absolute terms since the beginning of 2020 with the Covid pandemic and then the inflationary shock of 2022. While portfolios have held up well relative to peers, the 3 and 5 year absolute returns are lower than average, even though the since inception longer-term numbers are in line with expected parameters.
Summary
After a Q1 full of drama, April was a refreshingly boring month for markets.
Developed market equities posted modest gains and emerging posted modest losses. The main cause of this was a general lack of drama and generally positive economic data. PMIs in all of the UK, the US, and Europe came in above expectations. This is despite the continued rising rate environment.
The FTSE 100 was the best performing major market, returning 3.4% over the month, as a slight easing in fuel prices helped bring inflation down from 10.5% year on year to 10.1%. Europe performed similarly well, returning 2.3% for the month as inflation data eased from 8.5% to 6.9% year on year. The story in the US was much the same as the S&P returned 1.6% over the month, as headline inflation fell slightly, due in part to base effects. The direction of travel in core inflation is yet to change but the momentum from last year is certainly fading.
Other news is all quite moderate relative to what we have got used to:
Dominic Raab’s resignation seems a bit insignificant relative to the Autumn of UK politics we just had, and it feels like it was only a matter of time until Trump found himself on the wrong side of the law.
Over the past couple of days, the JPMorgan-First Republic deal has been getting a fair bit of airtime, but it seems like this is just part of the lifecycle of a US regional bank:
- Take deposits during the good times
- Assume the good times will last
- Mismanage the balance sheet risk you hold against these deposits
- Bad times come
- Get bailed out by JPMorgan …
Banks fail quite often. According to the FDIC, from 2008 to today, there have been 541 banking failures in the USA and only 26 of these were actually in 2008. Admittedly, the deposits that First Republic and SVB account for have been bigger than other failures since 2008, but they are still very far from systemically important players.
At the start of the month, OPEC+ announced that they would be cutting production by 3.7 million barrels per day – equivalent to 3.7% of global demand. This sounds like a lot, and a lot of economists got worried about how it might impact the inflation outlook. Much to OPEC+’s disappointment, there is a huge number of other factors that drive oil prices; hence oil prices have not skyrocketed and are sitting around $70 per barrel.
The last big thing that you might have read about this month is the US debt ceiling. The debt ceiling is just a cap on the total amount of money that the US government is authorised to borrow in order to fund government spending and meet obligations for outstanding debt. The ceiling is at $31.381 trillion and national debt has crossed the $31 trillion mark. The figure has got close to the “ceiling” before, but what often happens is that congress raises the debt ceiling … it’s a bit like refereeing the match you’re playing in. You spend more than the limit you set yourself, then you change the spending limit.
The risk people are worried about this time is that republicans won’t allow congress to pass the proposed increase in the ceiling. But this isn’t necessarily a problem – government debt accounting can help out. Essentially, only the principal on bonds is counted in the government debt pile, interest payments aren’t. The Treasury use this loophole by issuing what are called ‘premium bonds’, where more of each bond's cash flows to holders are considered to be interest as opposed to principal. In short – the US treasury is extremely unlikely to default because it is the US treasury who has the greatest control over whether they default or not.
Portfolio Positioning and Changes
During April, we did not make any major changes to portfolios.
Core views
At 7IM, we have a number of long-term core views that help to guide our investment decisions and allocations within portfolios.
Over the next 12 months, we think markets will generally move sideways with volatility. In this environment, it is important to rely on a stable identity. Economic uncertainty creates fear and investor sentiment tends to overreact to economic turning points. Going forward, we believe that:
- Inflation will come down. Goods inflation is slowly normalising, and supply chain pressures are easing.
- Central banks are getting close to the end of their hiking cycles, but there is still a bit more work to do.
- A US recession is highly likely. Most leading indicators point towards a recession, but the recession shouldn’t be too long or deep.
Investor sentiment overreacts to economic turning points …
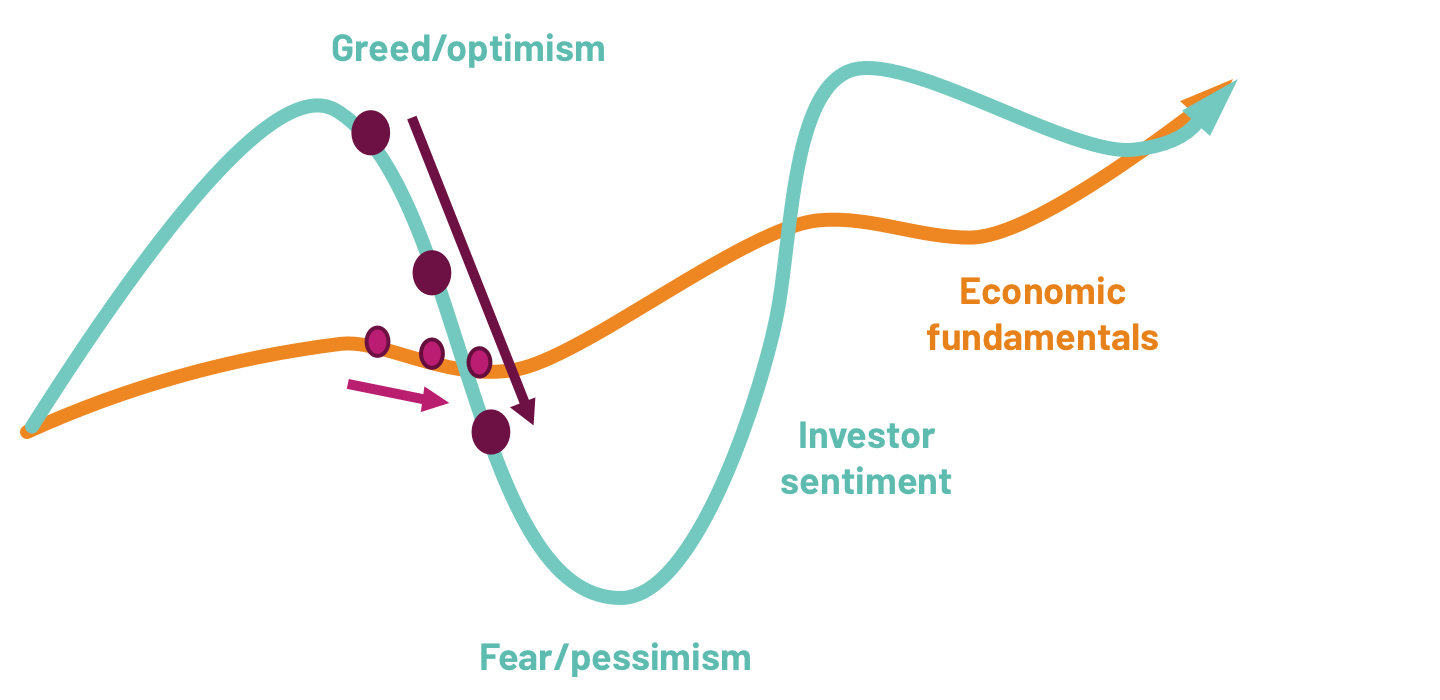
… with slightly weaker data leading to panic right now
Source: 7IM
And so, investors are starting to worry about what’s next for financial markets. Economic data isn’t likely to stabilise until next year, so ‘Sideways with volatility’ is the most likely scenario for the next few months.
We know our investment identity helps us to deliver in just these kinds of environments. We have positions that can generate returns despite this volatile backdrop.
Asset allocation
Detailed asset allocation
| Defensive | Cautious | Balanced | Moderately Adventurous | Adventurous | Income | |
|---|---|---|---|---|---|---|
| UK Equities | 4.50% | 6.50% | 15.00% | 18.25% | 26.00% | 8.75% |
| US Equities | 4.00% | 5.75% | 11.00% | 12.25% | 25.00% | 7.75% |
| European Equities | 2.00% | 2.50% | 3.25% | 6.25% | 11.00% | 3.00% |
| Japan Equities | 2.25% | 2.75% | 4.00% | 6.75% | 11.00% | 2.50% |
| Emerging Markets Equities | 1.75% | 2.75% | 2.50% | 5.25% | 11.00% | 2.50% |
| Global Themes | 3.50% | 6.00% | 9.50% | 13.00% | 0.00% | 4.00% |
| Global Government Bonds | 24.00% | 11.50% | 8.50% | 0.00% | 0.00% | 11.00% |
| Gilts* | 11.00% | 3.00% | 2.50% | 0.00% | 0.00% | 6.00% |
| UK Corporate Bonds | 5.00% | 8.50% | 5.00% | 0.00% | 0.00% | 10.00% |
| Global Corporate Bonds** | 9.25% | 14.25% | 4.00% | 0.00% | 0.00% | 18.75% |
| Global High Yield Bonds | 10.00% | 10.00% | 10.00% | 8.50% | 0.00% | 12.50% |
| Emerging Markets Bonds | 3.00% | 6.00% | 6.00% | 5.00% | 3.00% | 11.00% |
| Global Inflation Linked Bonds | 6.00% | 3.00% | 0.00% | 0.00% | 0.00% | 0.00% |
| Real Assets*** | 0.00% | 3.25% | 3.25% | 2.75% | 5.00% | 4.50% |
| Alternatives/Hedge Funds | 17.50% | 16.00% | 15.00% | 14.50% | 6.00% | 0.00% |
| Cash | -3.75% | -1.75% | 0.50% | 7.50% | 2.00% | -2.25% |
Source: 7IM. *Includes Short Term Sterling Bonds **Includes Convertible Bonds ***Includes Infrastructure


You can download the commentary as a PDF here.


