
Monthly commentary
Portfolio Performance
At 7IM, we believe that taking a long-term view is essential when investing. We can’t always avoid the short-term bumps and shocks that the financial world has in store, but a well-diversified portfolio goes a long way towards smoothing out some of the journey. The long-term nature of our strategic and tactical process is a good complement to the Succession Matrix Expected Parameters.
| Q1/2018 - Q1/2019 | Q1/2019 - Q1/2020 | Q1/2020 - Q1/2021 | Q1/2021 - Q1/2022 | Q1/2022 - Q1/2023 | 3 Year Ann. Return | 5 Year Ann. Return | Succession Matrix Expected Parameters – Ann. Return | |
|---|---|---|---|---|---|---|---|---|
| Defensive | 1.35% | -0.77% | 9.27% | 0.75% | -5.37% | -0.78% | 0.43% | 3.0 - 4.5% |
| Cautious | 0.71% | -2.54% | 13.96% | 2.41% | -4.47% | 1.22% | 1.36% | 4.5 - 6.0% |
| Balanced | 1.20% | -5.05% | 19.83% | 4.45% | -3.23% | 3.51% | 2.44% | 5.2 - 7.5% |
| Moderately Adventurous | 1.13% | -8.14% | 26.06% | 6.32% | -1.56% | 5.87% | 3.30% | 6.0 - 8.0% |
| Adventurous | 1.63% | -10.58% | 30.79% | 7.86% | -1.42% | 7.21% | 3.73% | 7.0 - 10.0% |
| Income | 3.28% | -8.68% | 18.97% | 4.16% | -3.28% | 2.57% | 1.72% |
Source: 7IM/FE. Annualised return is defined as ‘Ann. Return’ in the performance table above and is as at end May 2023. Market returns have been poor in absolute terms since the beginning of 2020 with the Covid pandemic and then the inflationary shock of 2022. While portfolios have held up well relative to peers, the 3 and 5 year absolute returns are lower than average, even though the since inception longer term numbers are in line with expected parameters..
Summary
Over May, there has been mega cap tech, and the rest. NVIDIA has been at the front of this as the GPU producer beat earning expectations and rallied 30% to (briefly) become a $1trn company. The theme of mega cap tech propping up the world feels familiar, especially since 2020, but this year the narrowness of US stock performance has been even more extreme.
Here are a few ways of breaking that down:
1. S&P equal weighted index versus the standard (market-cap weighted) S&P 500:
Year-on-year return gap: Equal-weighted vs Market Cap Weighted S&P

Source: Bloomberg
The S&P 500 weighted by market cap has outperformed its equal-weighted equivalent by around 12% since the start of the year – far more than it did through the whole of 2020. This means that, more so than any year since 2000, positive S&P 500 performance has been driven by a small number of stocks.
2. The five-firm concentration ratio of the S&P
5 largest companies in S&P 500 as a percentage of total

Source: Bloomberg
This chart shows the market cap of the 5 largest companies in the S&P divided by the total market cap of the S&P. What you can see is that, even after the sell-off in 2022, the S&P is still much more dominated by a few giants than it has tended to be in the past.
The argument can be made that the largest companies in the world justify these prices and relative dominance as valuations are not completely out of the ordinary and tech will no doubt shape our futures. But regardless of your view on valuations, you should absolutely be aware of the unwanted consequences of concentration.
The main one of these is that you have less diversification. S&P index investors have a higher percentage of their money in a smaller number of companies, most of which are in the same general industry – tech – meaning their share prices often react similarly to economic events.
3. The Biggest Single Driver of Monthly Moves
Getting more granular, we can look at how much NVIDIA alone has contributed over the month of May. The table below shows the single stock that has had the largest individual contribution to the S&P each month since the start of the year.
| Month | Largest contributor | % Contribution |
|---|---|---|
| Jan 2023 | Apple | 9.9% |
| Feb 2023 | Tesla | 7.6% |
| March 2023 | Microsoft | 24.9% |
| April 2023 | Microsoft | 26.3% |
| May 2023 | NVIDIA | 68.6% |
Source: Bloomberg
The data point is calculated as percentage change in share price multiplied by weight in index, divided by percentage change in index
What this shows is that (a) big tech has been running the show this year, and (b) NVIDIA has really shot the lights out during May, accounting for most of the S&P’s performance. The S&P’s performance in May has been incredibly narrow.
These are just a few reasons why we are cautious about investing passively in the S&P and prefer a more diversified, thoughtful approach.
Portfolio Positioning and Changes
During May, we rebalance our model portfolios. The details of that can be found here: https://www.7im.co.uk/succession/news-views/quarterly-rebalance-commentary-may-2023
Core views
At 7IM, we have several long-term core views that help to guide our investment decisions and allocations within portfolios.
Over the next 12 months, we think that the global economy will slide into a recession. In this environment, it is important to rely on a stable identity. Economic uncertainty creates fear and investor sentiment tends to overreact to economic turning points. Going forward, we believe that:
- Inflation will come down. Goods inflation is slowly normalising, and supply chain pressures are going
- Central banks are getting close to the end of their hiking cycles, but there is still a bit more work to do
- A US recession is highly likely. Most leading indicators are pointing towards a recession, but the recession shouldn’t be too long or deep.
Investor sentiment overreacts to economic turning points …
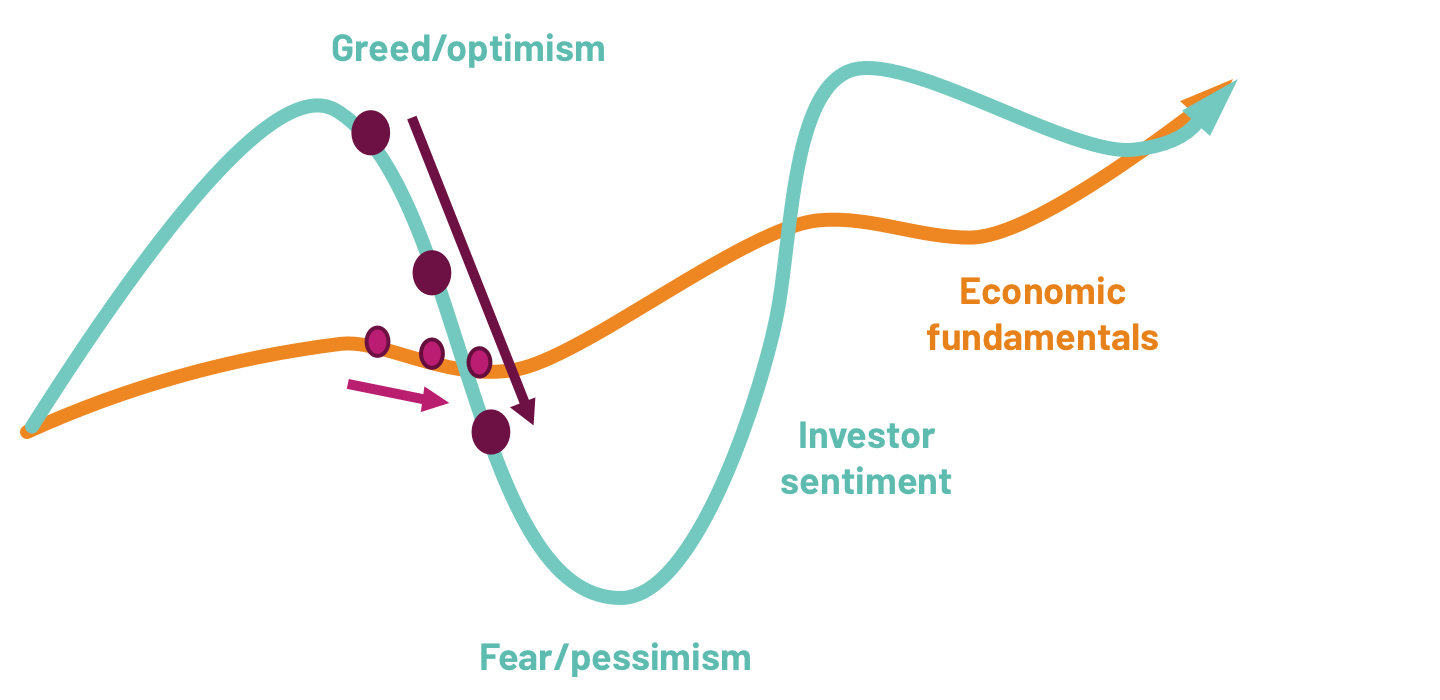
… with slightly weaker data leading to panic right now
Source: 7IM
And so, investors are starting to worry about what’s next for financial markets. Economic data isn’t likely to stabilise until next year. Equity markets are unlikely to perform well.
We know our investment identity helps us to deliver in just these kinds of environments. We have positions that can generate returns despite this volatile backdrop.
Asset allocation
Detailed asset allocation
| Cautious TAA | Moderately Cautious TAA | Balanced TAA | Moderately Adventurous TAA | Adventurous TAA | Income TAA | |
|---|---|---|---|---|---|---|
| UK Equities | 6.25% | 8.00% | 16.75% | 19.75% | 22.25% | 10.50% |
| US Equities | 3.50% | 6.00% | 10.75% | 11.50% | 11.75% | 8.00% |
| European Equities | 2.75% | 3.25% | 3.75% | 6.00% | 6.75% | 3.75% |
| Japan Equities | 2.25% | 3.25% | 4.50% | 7.00% | 8,75% | 2.50% |
| Emerging Markets Equities | 1.75% | 2.75% | 2.25% | 4.75% | 8.00% | 2.50% |
| Global Themes | 5.00% | 6.50% | 10.50% | 14.50% | 18.50% | 4.00% |
| Global Government Bonds | 26.00% | 13.00% | 8.50% | 0.00% | 0.00% | 13.00% |
| Gilts* | 11.00% | 3.00% | 2.50% | 0.00% | 0.00% | 6.00% |
| UK Corporate Bonds | 5.00% | 8.50% | 5.00% | 0.00% | 0.00% | 10.00 |
| Global Corporate Bonds** | 6.25% | 12.75% | 4.00% | 0.00% | 0.00% | 18.75% |
| Global High Yield Bonds | 3.50% | 3.50% | 4.50% | 5.00% | 5.00% | 6.00% |
| Emerging Markets Bonds | 3.00% | 6.00% | 6.00% | 5.00% | 0.00% | 11.00% |
| Global Inflation Linked Bonds | 6.00% | 3.00% | 0.00% | 0.00% | 0.00% | 0.00% |
| Real Assets*** | 0.75% | 4.00% | 3.25% | 2.75% | 4.50% | 0.00% |
| Alternatives/Hedge Funds | 20.50% | 17.50% | 15.00% | 14.50% | 12.00% | 0.00% |
| Cash | -3.50% 0.00% | -1.00% 0.00% | 2.75% 0.00% | 9.25% 0.00% | 2.50% 0.00% | -0.75% 4.75% |
Source: 7IM. *Includes Short Term Sterling Bonds **Includes Convertible Bonds ***Includes Infrastructure


You can download the commentary as a PDF here.


